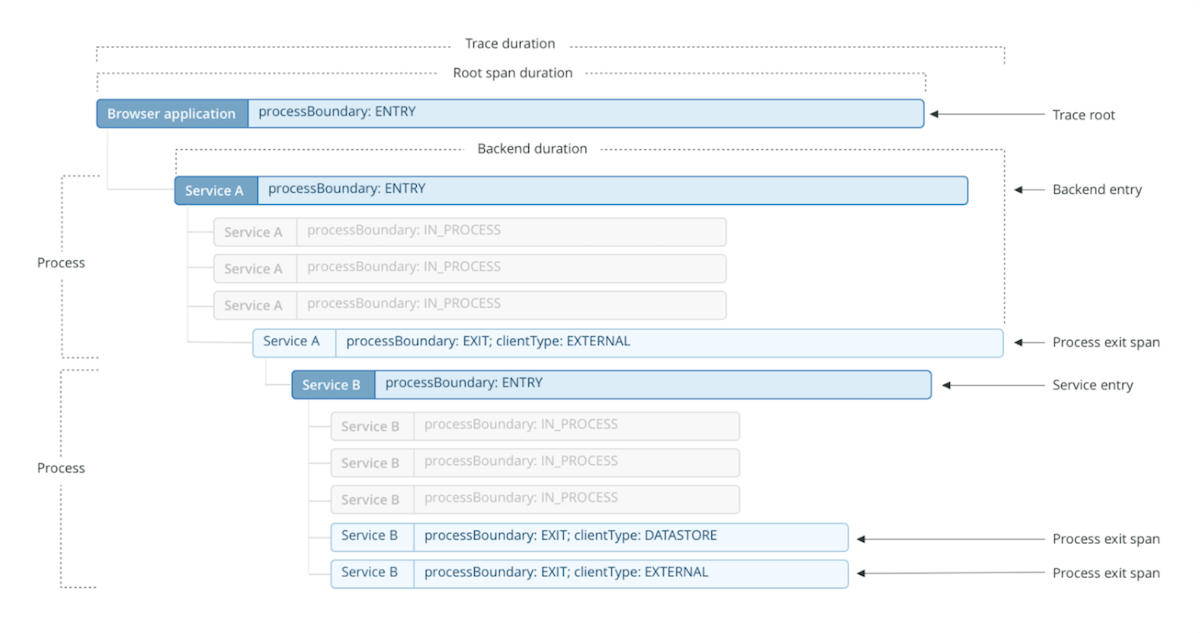
Correlate Requests With a Unique ID
Think back to the request calling chain between Services A, B, and C that I talked about in the previous section. Following from this idea, it's a good practice to tag each call with a unique ID that identifies the request.
For example, let's say you're logging access and error logs for each service. If you find an error in Service B, it might be useful for you to know whether the error was caused by the request coming from Service A or the request sent to Service C.
Maybe the error is informative enough that you don't even need to reproduce it. But if that isn't the case, the correct way to reproduce the error is to know all possible requests in the services that are related to, say, Service B. When you have a correlation request ID, then you only need to look for that ID in the logs. And you'll get all logs from services that were part of the main request to the system. You'll also know which service the main request spends the most time in, if the service is using the cache, if a service is calling other services more than once, and a lot of other interesting details.
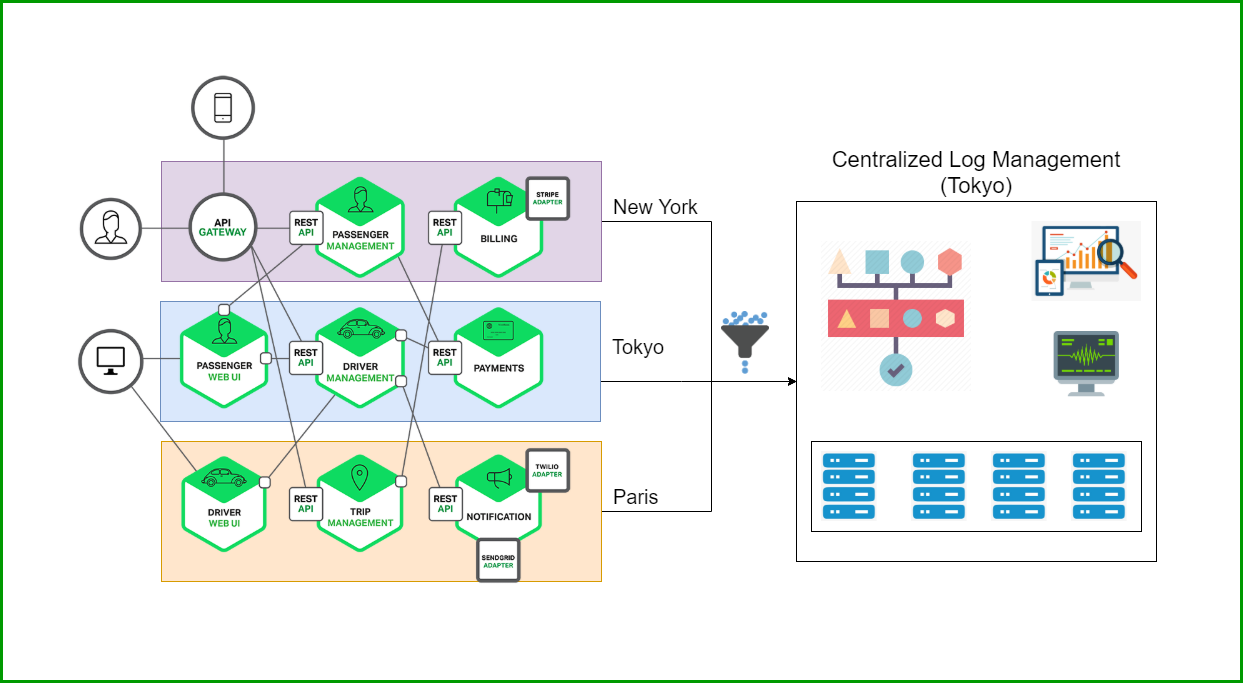
Send Logs to a Centralized Location
Let's assume that you're already adding all sorts of useful information to your logs. But it's essential to send logs to a centralized location.
Think about it. If you have to log in to each individual server to read logs, you'll spend more time trying to correlate problems than if you just had one location where you could access all logs. Also, systems usually get more complicated as time goes by, so the amount of microservices usually grows too. And to make things even more complicated, services could be hosted on different servers or providers.
Centralized logging is becoming the norm, especially if you're working with cloud, container, or hybrid environments because the servers could be terminated without any notice. For example, containers are terminated if there's an unexpected error, or the memory reaches 100 percent of its consumption capacity.
You could solve this problem by having agents pulling and pushing logs every five minutes or before servers get terminated. You could also configure a cronjob in the server, a sidecar container, or a shared file location where another process could centralize logs. Avoid the temptation of building a solution stack by yourself, aswhere to centralize logging is a well-known problem that's already solved.
Having logs from all of your services in one place makes it easy and efficient to correlate problems.
Make sure log aggregation is truly centralized
It’s not enough to aggregate some log data into one place (such as a public cloud vendor’s log manager, like CloudWatch) and aggregate other data somewhere else (like a third-party log management tool). Although this approach may seem like the way to go if some microservices run in one location and others run somewhere else, you need all of your log data in a single location if you want to analyze and store it effectively.
Structure Your Log Data
It's going to be almost impossible to have a defined format for log data; some logs might need more fields than others, and those that don't need all those excess fields will be wasting bytes. Microservice architecture addresses this issue by using different technology stacks, which impacts the log format of each service. One service might use a comma to separate fields, while others use pipes or spaces.
All of this can get pretty complicated. Make the process of parsing logs simpler by structuring your log data into a standard format like JavaScript Object Notation (JSON). JSON allows you to have multiple levels for your data so that, when necessary, you can get more semantic info in a single log event.
Parsing is also more straightforward than dealing with particular log formats. With structured data, the format of logs is standard, even though logs could have different fields. You'll also be able to create searches in the centralized location like looking for logs that have an "http_code" of 500 and above. Use structured logging to have a standard but flexible format in your microservices logs.
Add Context to Every Request
I don't know about you, but when something goes wrong, I want to know everything! Having enough information about an issue provides you with important context for the request. Knowing what could have caused the problem is essential, and having the right context will help you to understand what's happening more quickly. But adding context to logs could become a repetitive task in code because there's going to be common data like date and time that you'll need in each log event. So in code, logging will look simpler because you'll only be logging the message and other unique areas.
You might want to log all the data you can get. But let me give you some specific fields that could help you figure out what you really need to log.
- Date and time. It doesn't have to be UTC as long as the timezone is the same for everyone that needs to look at the logs.
- Stack errors. You could pass the exception object as a parameter to the logging library.
- The service name or code, so that you can differentiate which logs are from which microservice.
- The function, class, or file name where the error occurred so that you don't have to guess where the problem is.
- External service interaction names-you'll know which call to the DB was the one with the problem.
- The IP address of the server and client request. This information will make it easy to spot an unhealthy server or identify a DDoS attack.
- User-agent of the application so that you know which browsers or users are having issues.
- HTTP code to get more semantics of the error. These codes will be useful to create alerts.
- Contextualizing the request with logs will save you time when you need to troubleshoot problems in the system.
Collect Logs to Persistent Storage
As noted above, microservices often run inside infrastructure—like a container—that lacks persistent storage. A basic and essential best practice in that case is to ensure that log data is written to somewhere where it will be stored persistently and remain available if the container shuts down.
You could do this by modifying source code or your container configurations to ensure that the logs are written to an external storage volume. An easier approach, however, is to run a logging agent that will collect data from the containerized microservice in real time and aggregate it within a reliable storage location.
This way, you kill two birds with one stone (or logging agent, as it were): You aggregate logs and move log data to persistent storage, all in one step.
Log Useful and Meaningful Data to Avoid Regret
These are just some ordinary things that help you log microservices. If you're just starting out with logging, these practices might not make much sense and seem useless. But once you've been using microservices for a while, they'll save you a lot of trouble. Just make sure you're always evaluating what you're logging. You'll have a better idea of what's important to log when you're troubleshooting and say to yourself "I wish I had X and Y information so I could spot these weird errors more easily."
Once you're logging enough data, it's time to automate things like alerts. You shouldn't have to spend a ton of time reading logs to spot problems. Automating alerts will also help you to be proactive and keep errors from spreading to all of your users.
Having a centralized logging location to make further analysis is a must in microservices. Adding enough context to logs will make the difference in identifying what log data is useful, and what data is useless.
Logs aggregations
Use custom parsing
Because microservices logs are often structured in multiple ways, trying to search through all of your data using generic regexes is typically not very effective. Instead, consider writing custom parsing rules that govern how your log analytics tool identifies relevant trends within log data, even if you are working with logs of varying types or structures.
Make Logs Searchable
Make sure all the fields available in the logs are searchable. For example, If you get ahold of the correlation ID, you can search all the logs based on that t to find out the request flow.
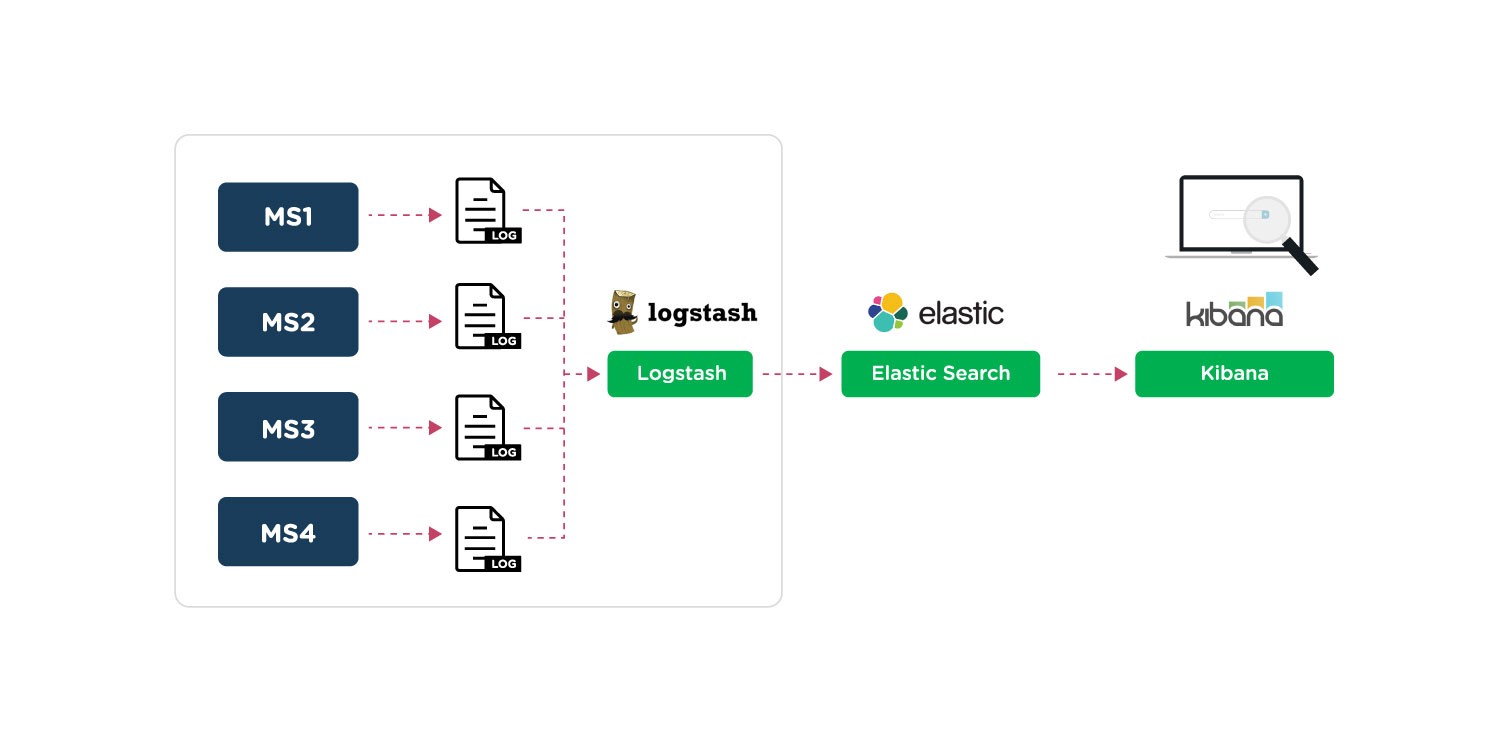
The amount of logs collected is usually very large. Therefore, we need to optimize the storage and especially ensure query performance. To do that we need to indexing logs data before putting it into durable storage.
For example, we use ELK to collect and process logs. We will index on Elasticsearch.
Visualize log data
When working in microservices-based applications, developers often need to examine the state of an application, as well as information on any issues, downtimes or latency. Teams can add dashboard features that provide a visual depiction of the information carried into the application logs.
Log visualization illustrates aggregated information for the services. This information may include, but is not limited to, requests, responses and size of responses. There are various log visualization tools available, such as Scalyr, Graylog, Kibana and Sematext.
Data partitioning to optimize storage cost
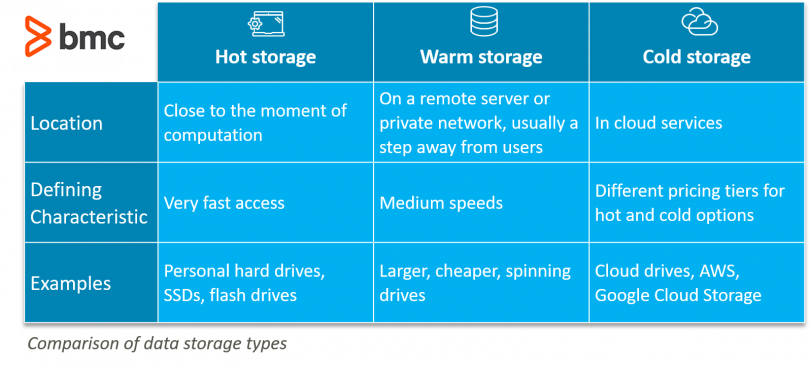
With a huge amount of data from logs, the problem of optimizing storage costs is a big problem. According to the design pattern for big data storage, we will partition the data by query terms, including:
- Hot data: frequently queried data is usually new logs or realtime logs.
- Warm data: are data types that are not frequently queried. Middle term query. Usually historical data will be used to access when needed.
- Cold data: are data types that are almost not used for querying, but for the purpose of archiving and long-term storage.
Because the cost for different types of hosting services is also different according to the query plan. So we need to set up plans to transfer logs data right for the purpose of use to optimize costs. For example, for Storage services for Hot data, the cost of the bandwitch will be quite low and the cost of storage and access speed will be quite high. In contrast to Storage services for Cold data, the cost for storage is quite low, but the cost of access will be more expensive and of course the access speed will be lower. The cost difference between Storage services for data types depends on the Query plan that needs corresponding hardware configuration.
Read more:
References: